


Google Analytics offers a ton of up-front/top-level information. The way Google provides information and allows users to slice and dice the information works well for many cases. However, there are some shortcomings where utilizing filters and secondary dimensions can only get you so far, and on top of that, it can be relatively time-consuming. This is where segments come in — and where we can help.
What is a segment?
A “segment” in Google Analytics lets you decide exactly what information you want to see. It then filters all of the information within Google Analytics to only include that particular sub-section of traffic.* This means you can use Google Analytics exactly how you normally would. It just provides the information you are looking for up-front, rather than needing to filter and use secondary dimensions. In our Five-Part Framework for Hospital Marketing Success, we recommend using segmenting audience, geography, and goals to help you move away from aggregate data and towards a clearer picture of how your marketing efforts are really doing. Here’s how.
*Note: A caveat is that depending on sample size, some demographic information may not be available.
How to set up a segment
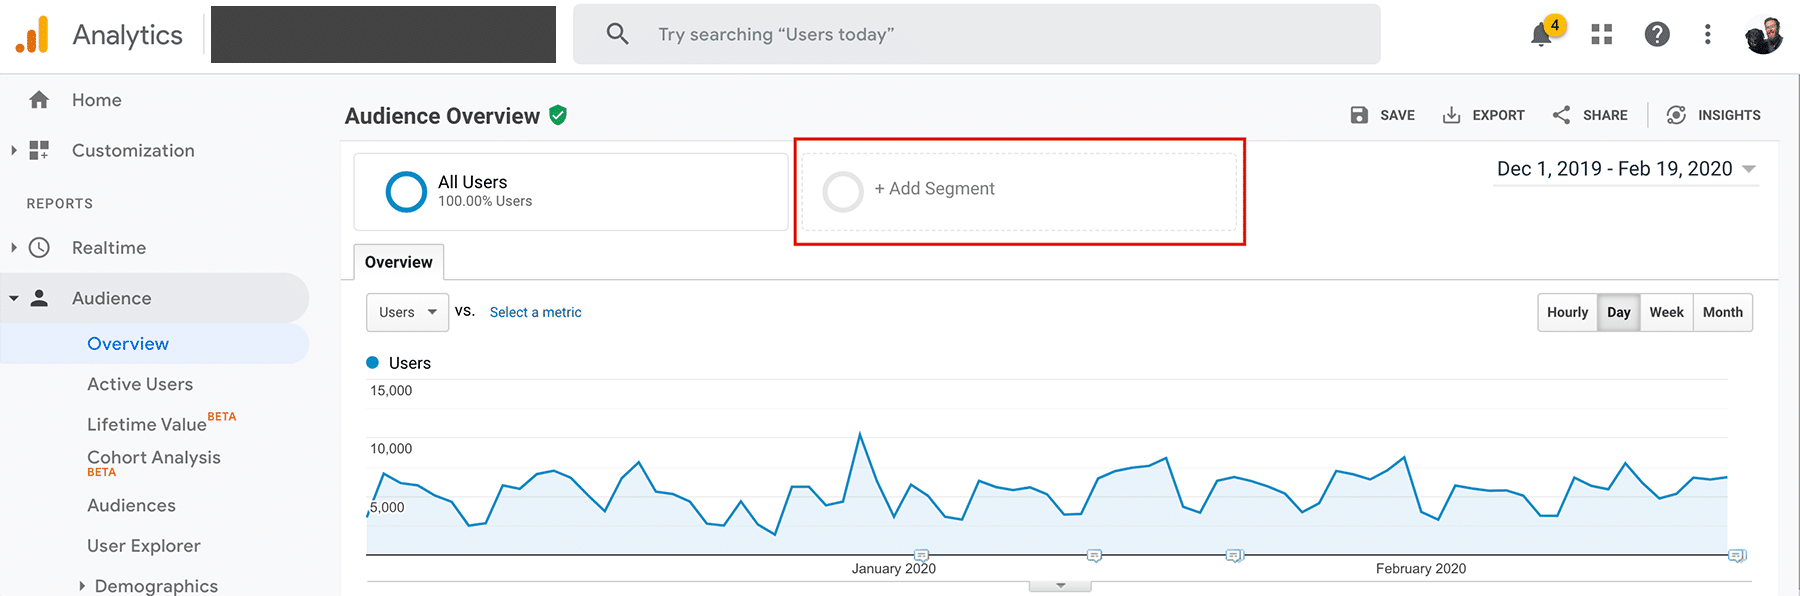
1. Upon loading up Google Analytics you will see the “Add Segment” option featured at the top of the majority of reporting pages.
2. Once you click this option you will see all of the current segments that have been previously built. There are some default segments that may be useful, so feel free to browse these if you’d like.
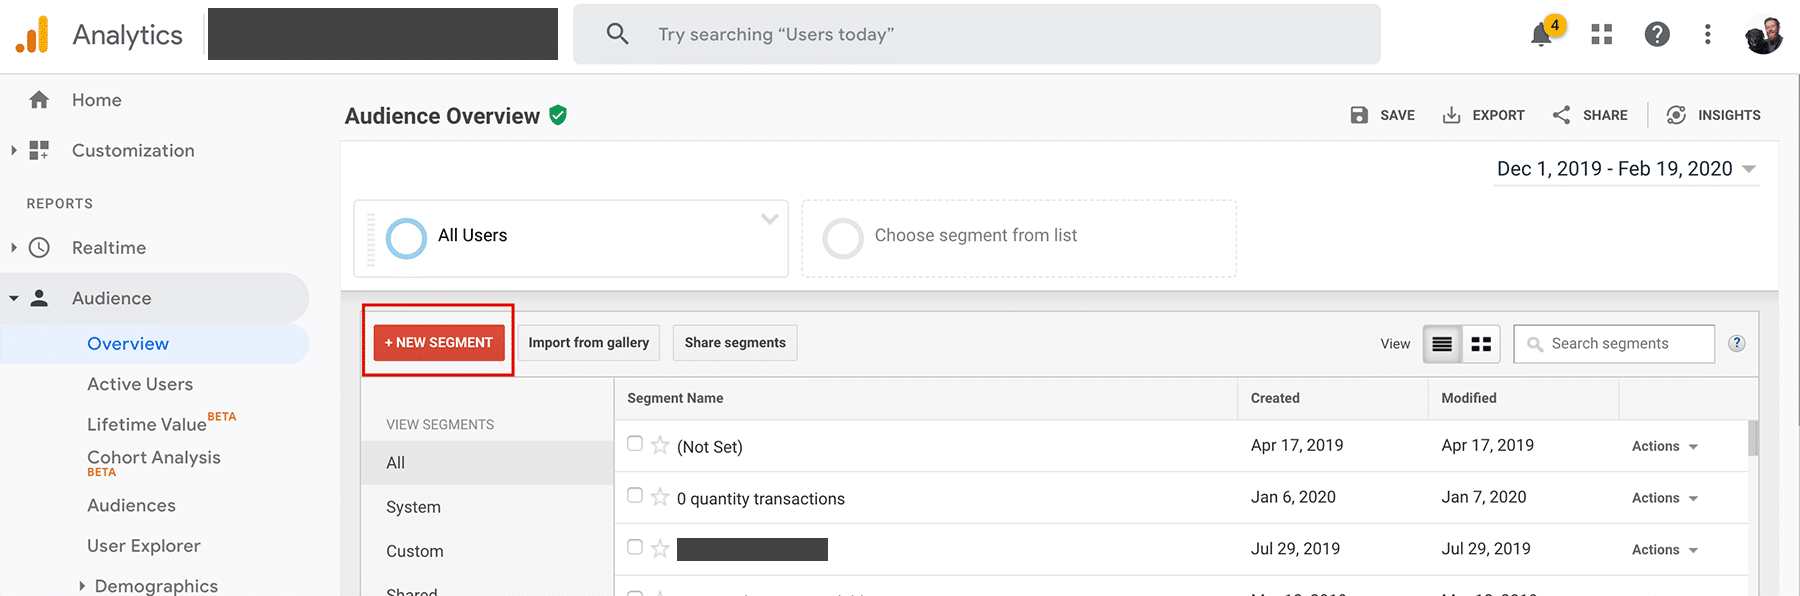
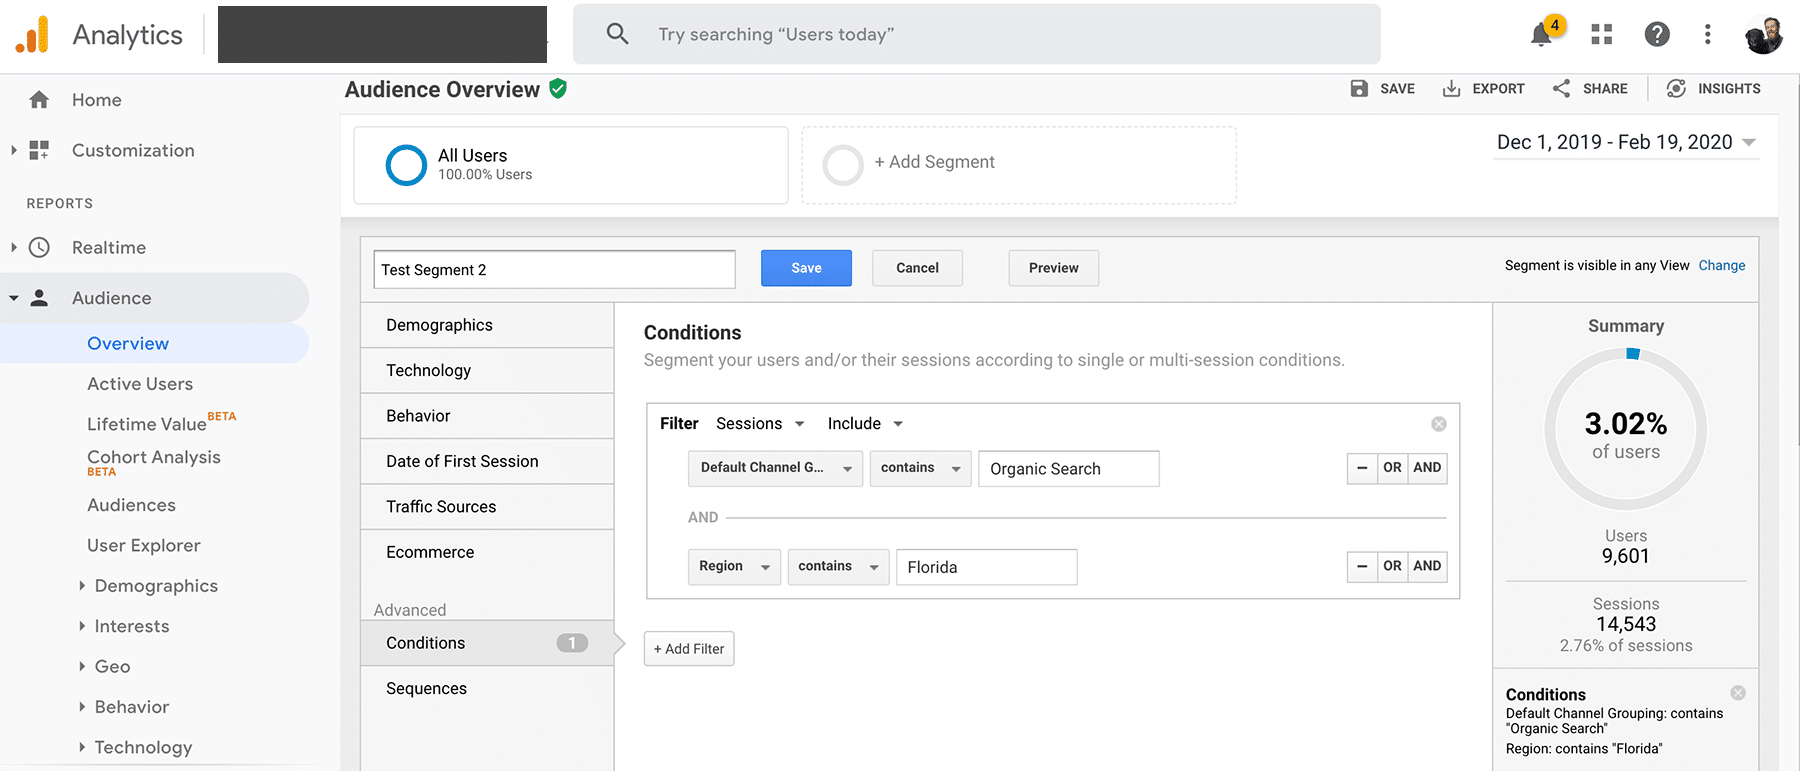
3. To create your own segment, you will click the “new segment” button. This will open up the screen that allows you to customize your segment to show whatever information you are looking for. As shown in the screenshot below, there are a lot of options to choose from. The majority of the time, I work from the “conditions” tab.
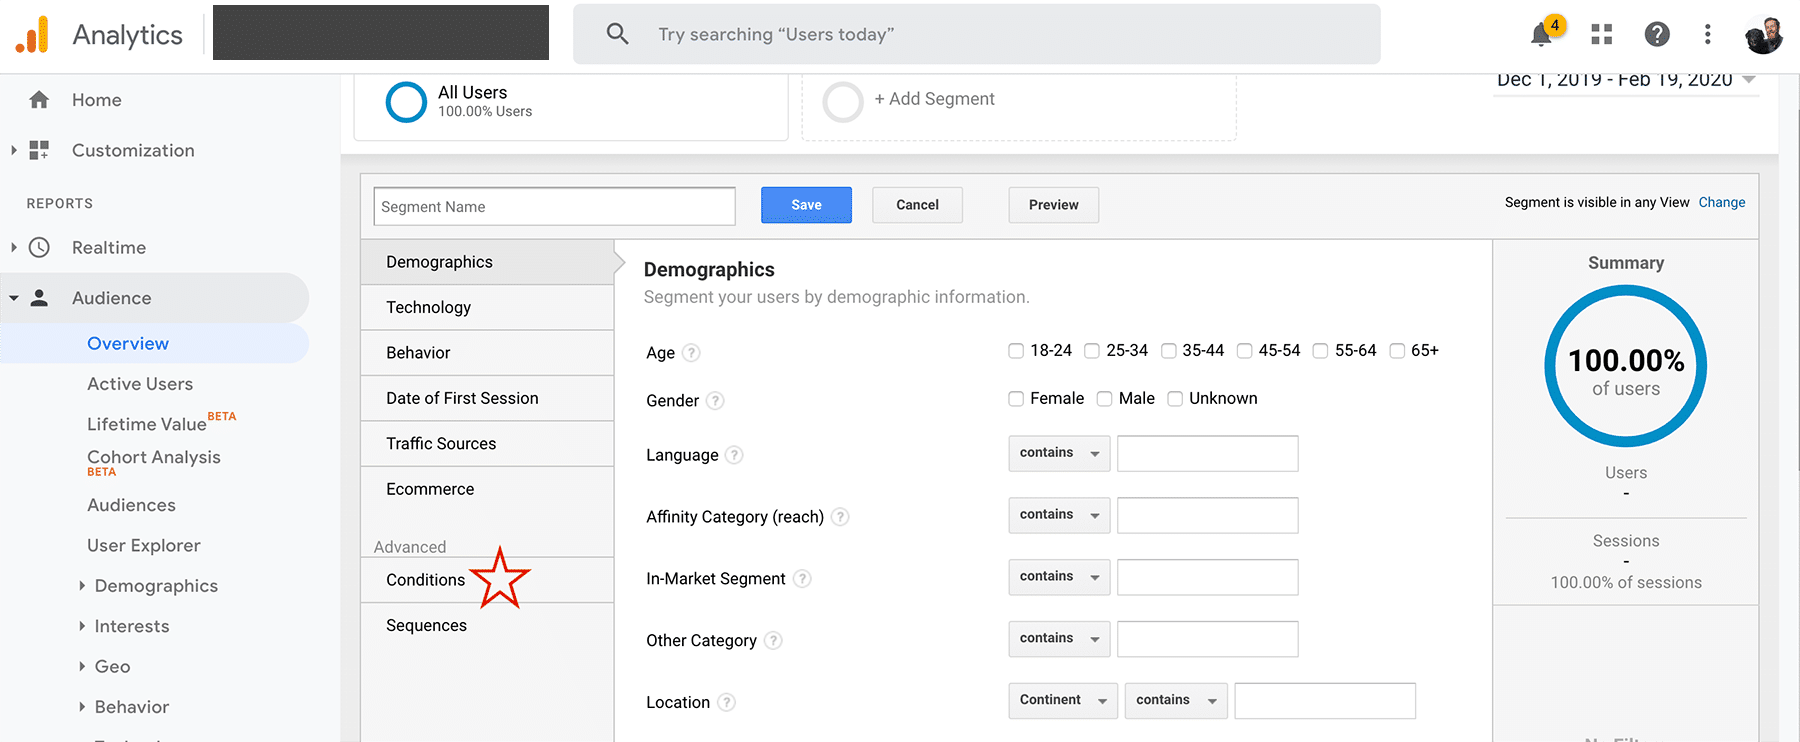
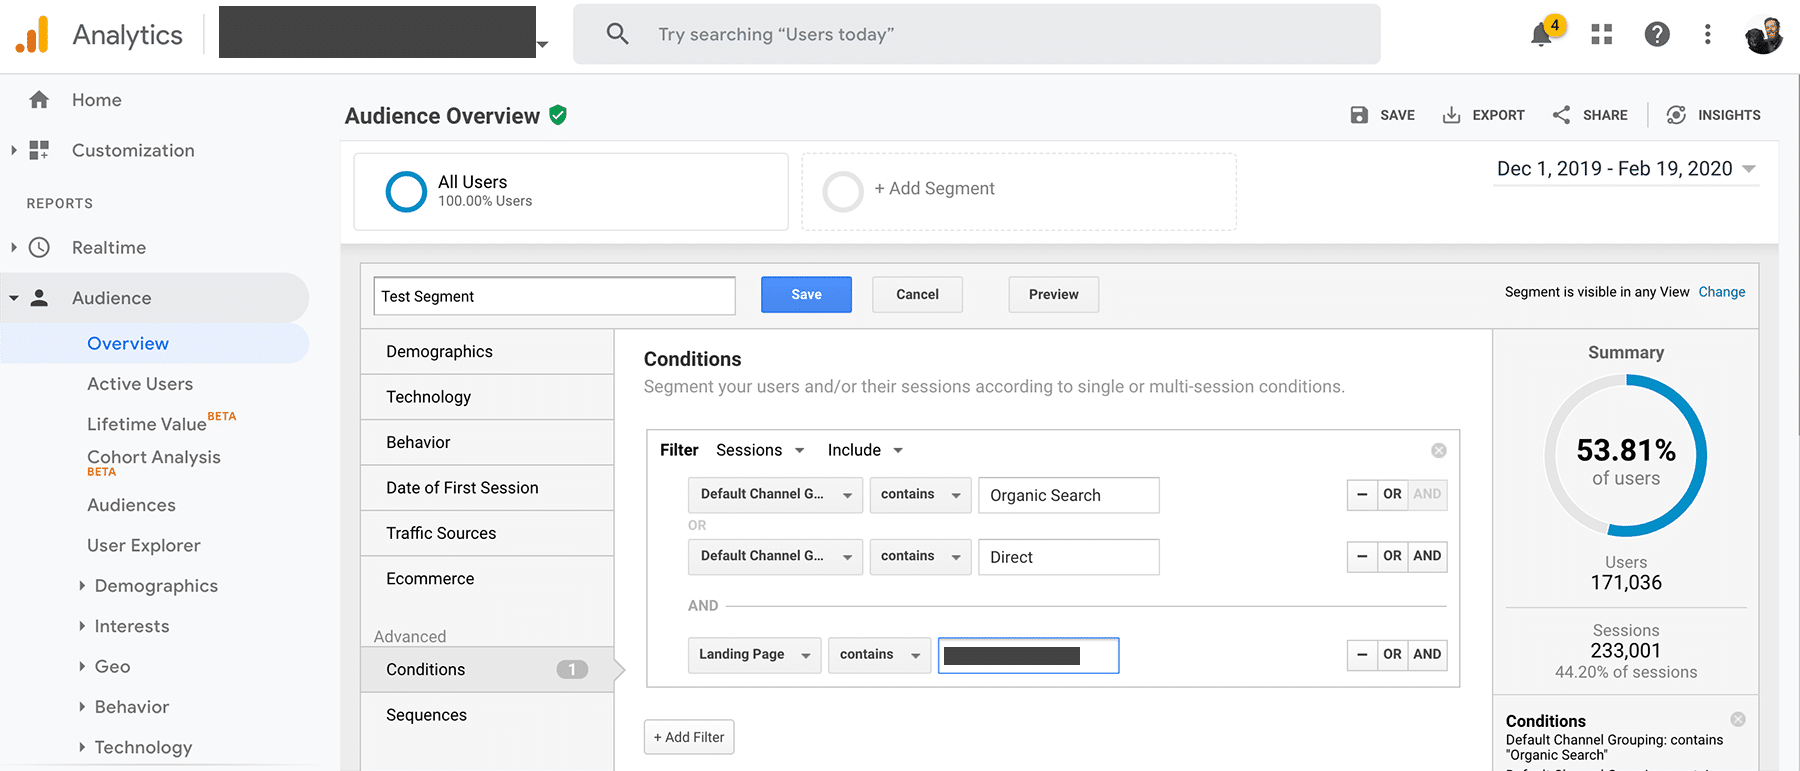
4. From there, you can select whatever qualifiers you are interested in for your particular segment. As an example, you can select that you want to see only information for users landing on the homepage coming from to the site from Organic Search or Direct channels.
5. Or, if you’re curious what our remote Performance Media Manager Wyeth Leemon and his fellow Florida Folk are doing on the site you can elect to only view users coming to the site who are located in Florida.
Using Filters
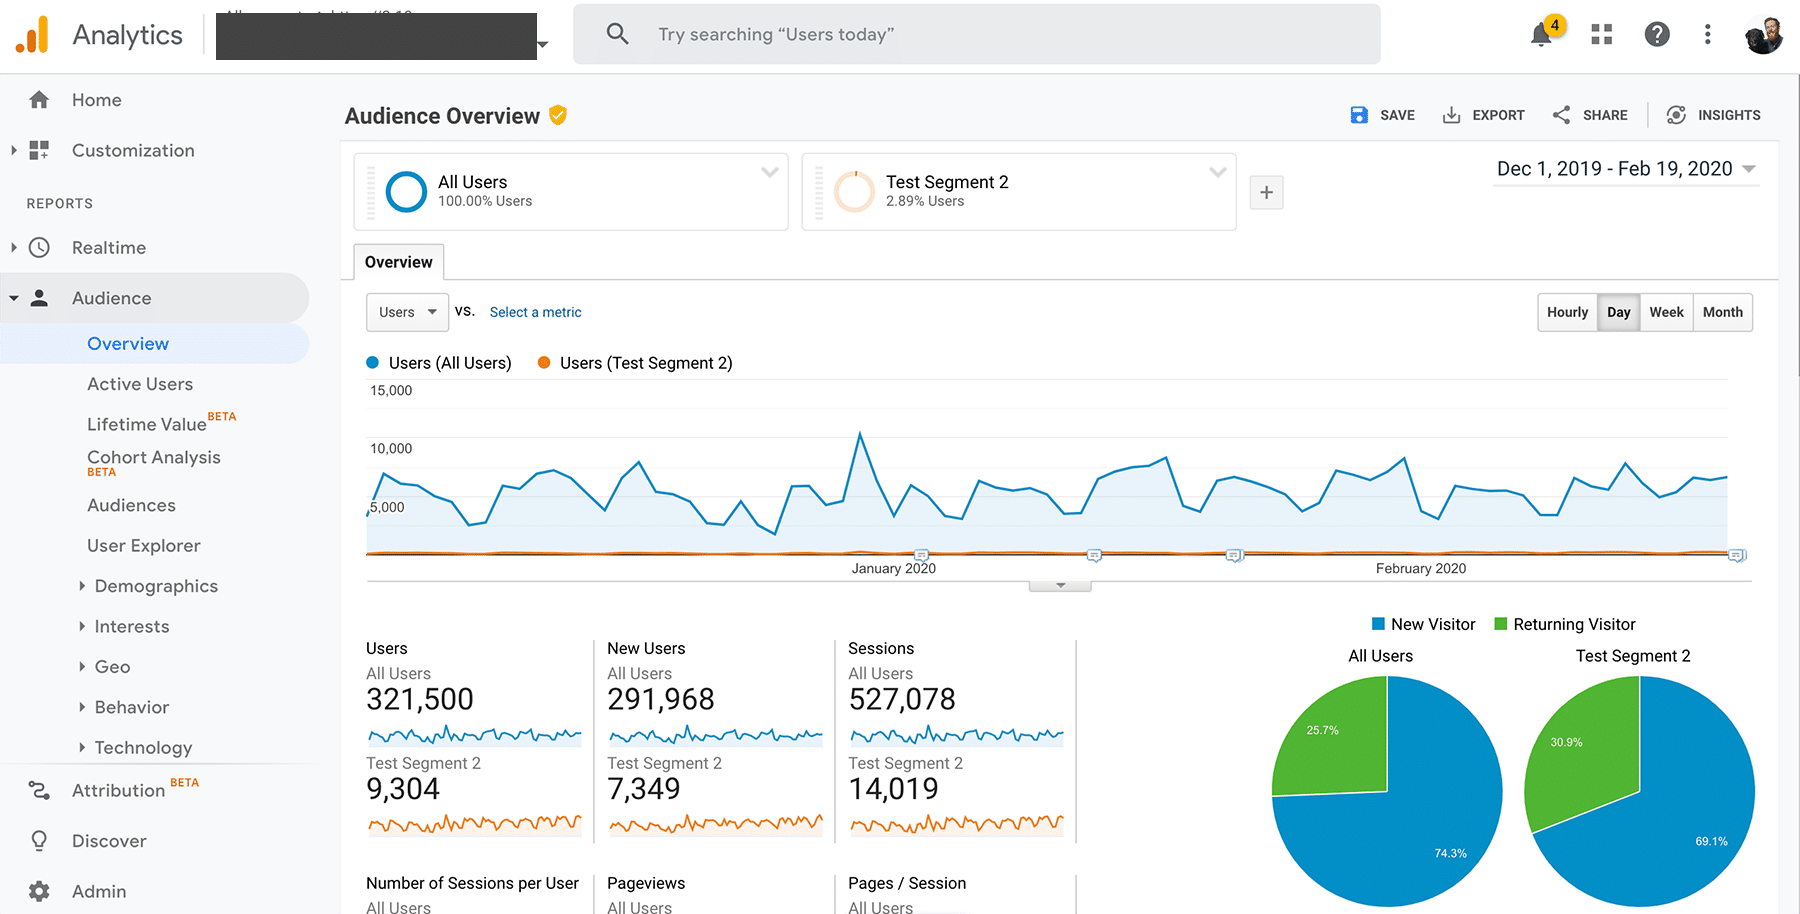
Once you determine the specifics of your segment, you can save the segment and move forward with your analysis. As shown in the screenshots below, Google Analytics will report on your segmented data individual of each other. I personally like to keep the “all users” filter on in most cases so I can see how an individual segment performs in relation to the site total.
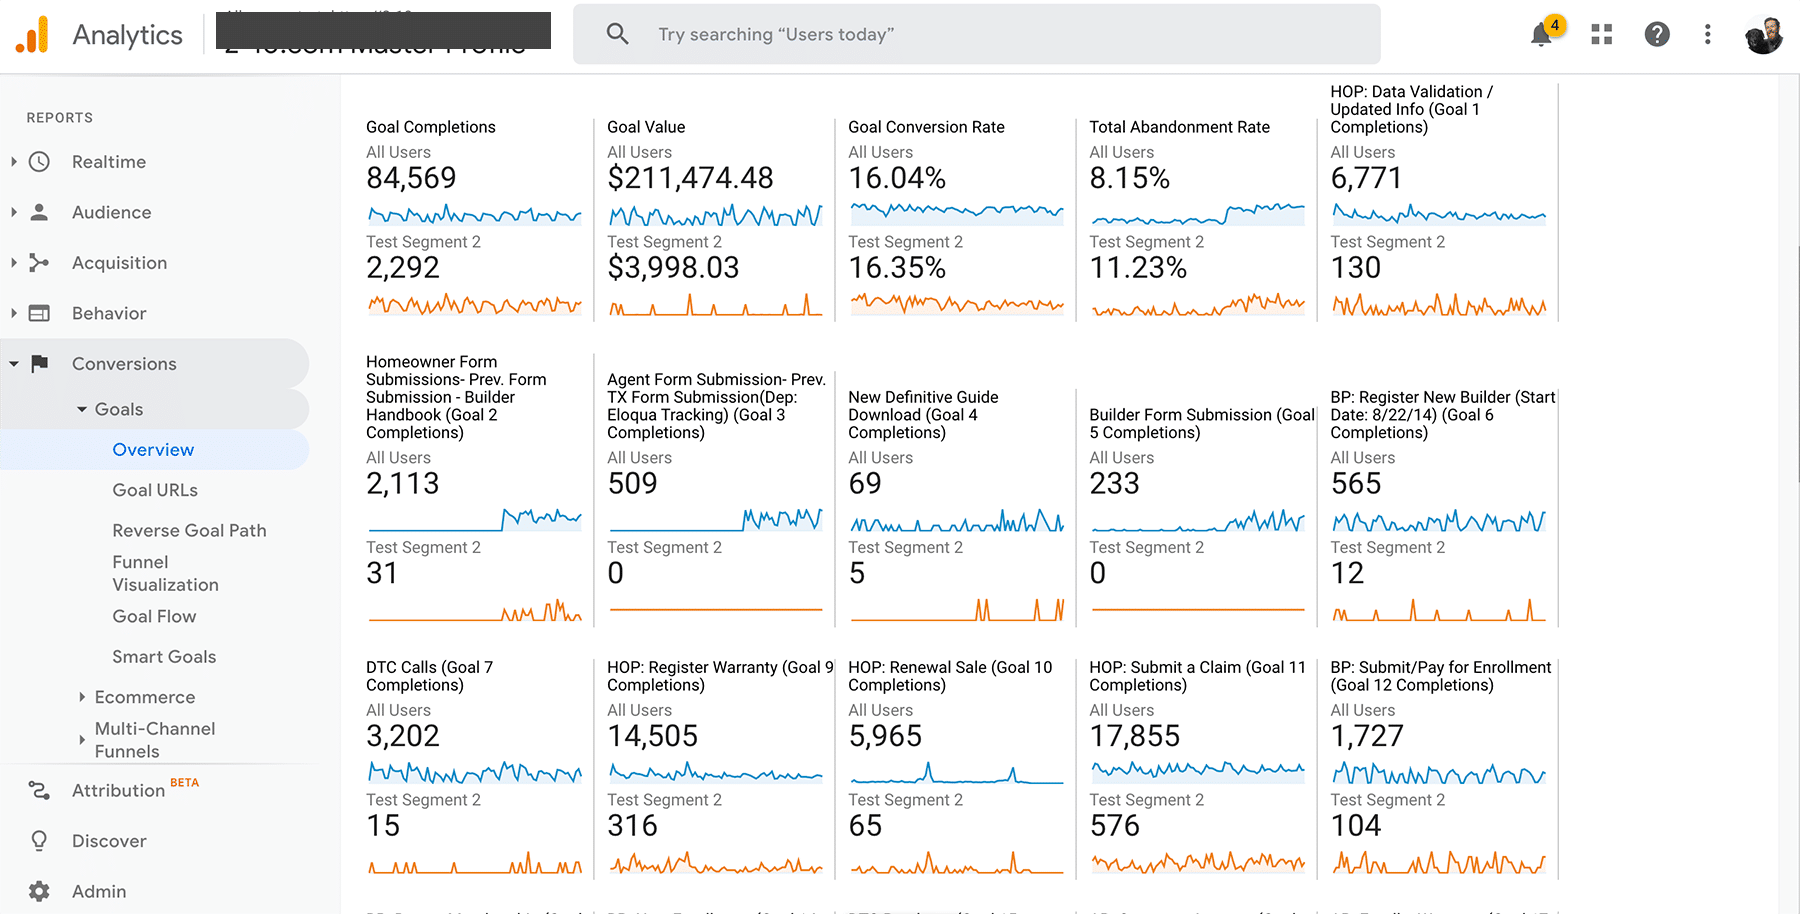
In the few examples located below, we can see that during this timeframe, organic traffic from Florida was responsible for 14,019 of the 527,078 total visits and 2,292 out of the site total of 85,569 goal completions.
Don’t be afraid to try something new!
“Segments” is a Google Analytics feature that is extremely helpful when conducting an analysis of your organization: region, channel, source, landing page, or all of the above. Crucially, it helps provide a clearer picture of your traffic data than blended data do. Using segments can help you better communicate to your stakeholders exactly how well your marketing efforts are working, and provide key insights for strategic planning.
I urge you to play around with the feature yourself and reach out if you have any questions.