

A Digital Marketing Checklist to Make Your Data Work for You
Digital marketing analytics can provide a wealth of information regarding consumers’ preferences, behaviors, and desires. It can also help marketers measure the effectiveness of their marketing practices and strategies. There are hundreds of ways for brands to use data to grow their business.
Unfortunately, many businesses don’t know how to collect or utilize consumer data to their advantage. Don’t let this data go to waste. Use this five-point digital marketing checklist to make the most out of your data.
1. Set up the proper analytics code on your site via Google Tag Manager
Having the proper code is essential to making the most out of digital marketing analytics. The proper code is the foundation of digital analytics, so it is impossible to build a usable data structure without it.
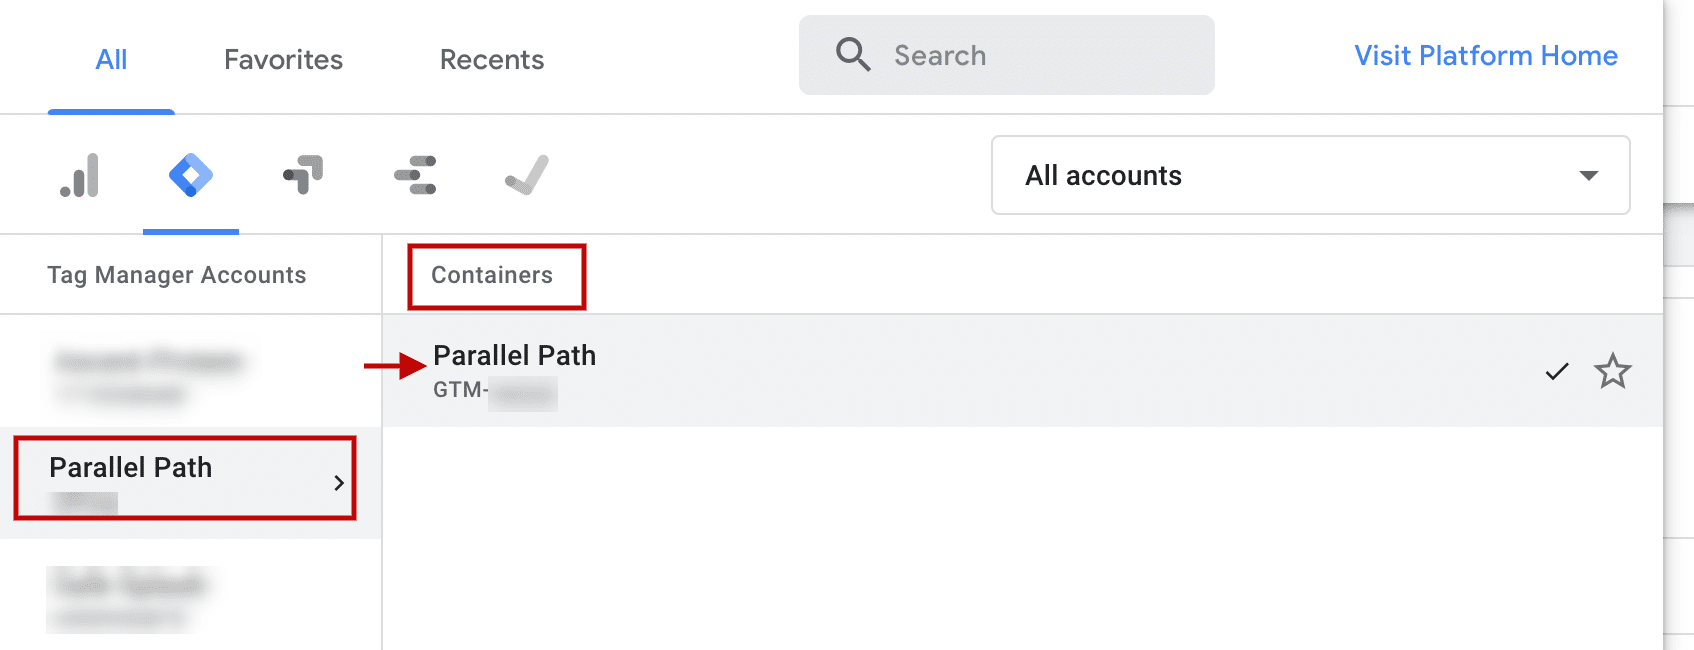
To find the Google Tag Manager (GTM) tracking code, log into your account and click on “Container ID” in the header bar.
You will need to copy and paste two different pieces of code to properly install GTM. This information can be found within the admin section of Tag Manager.
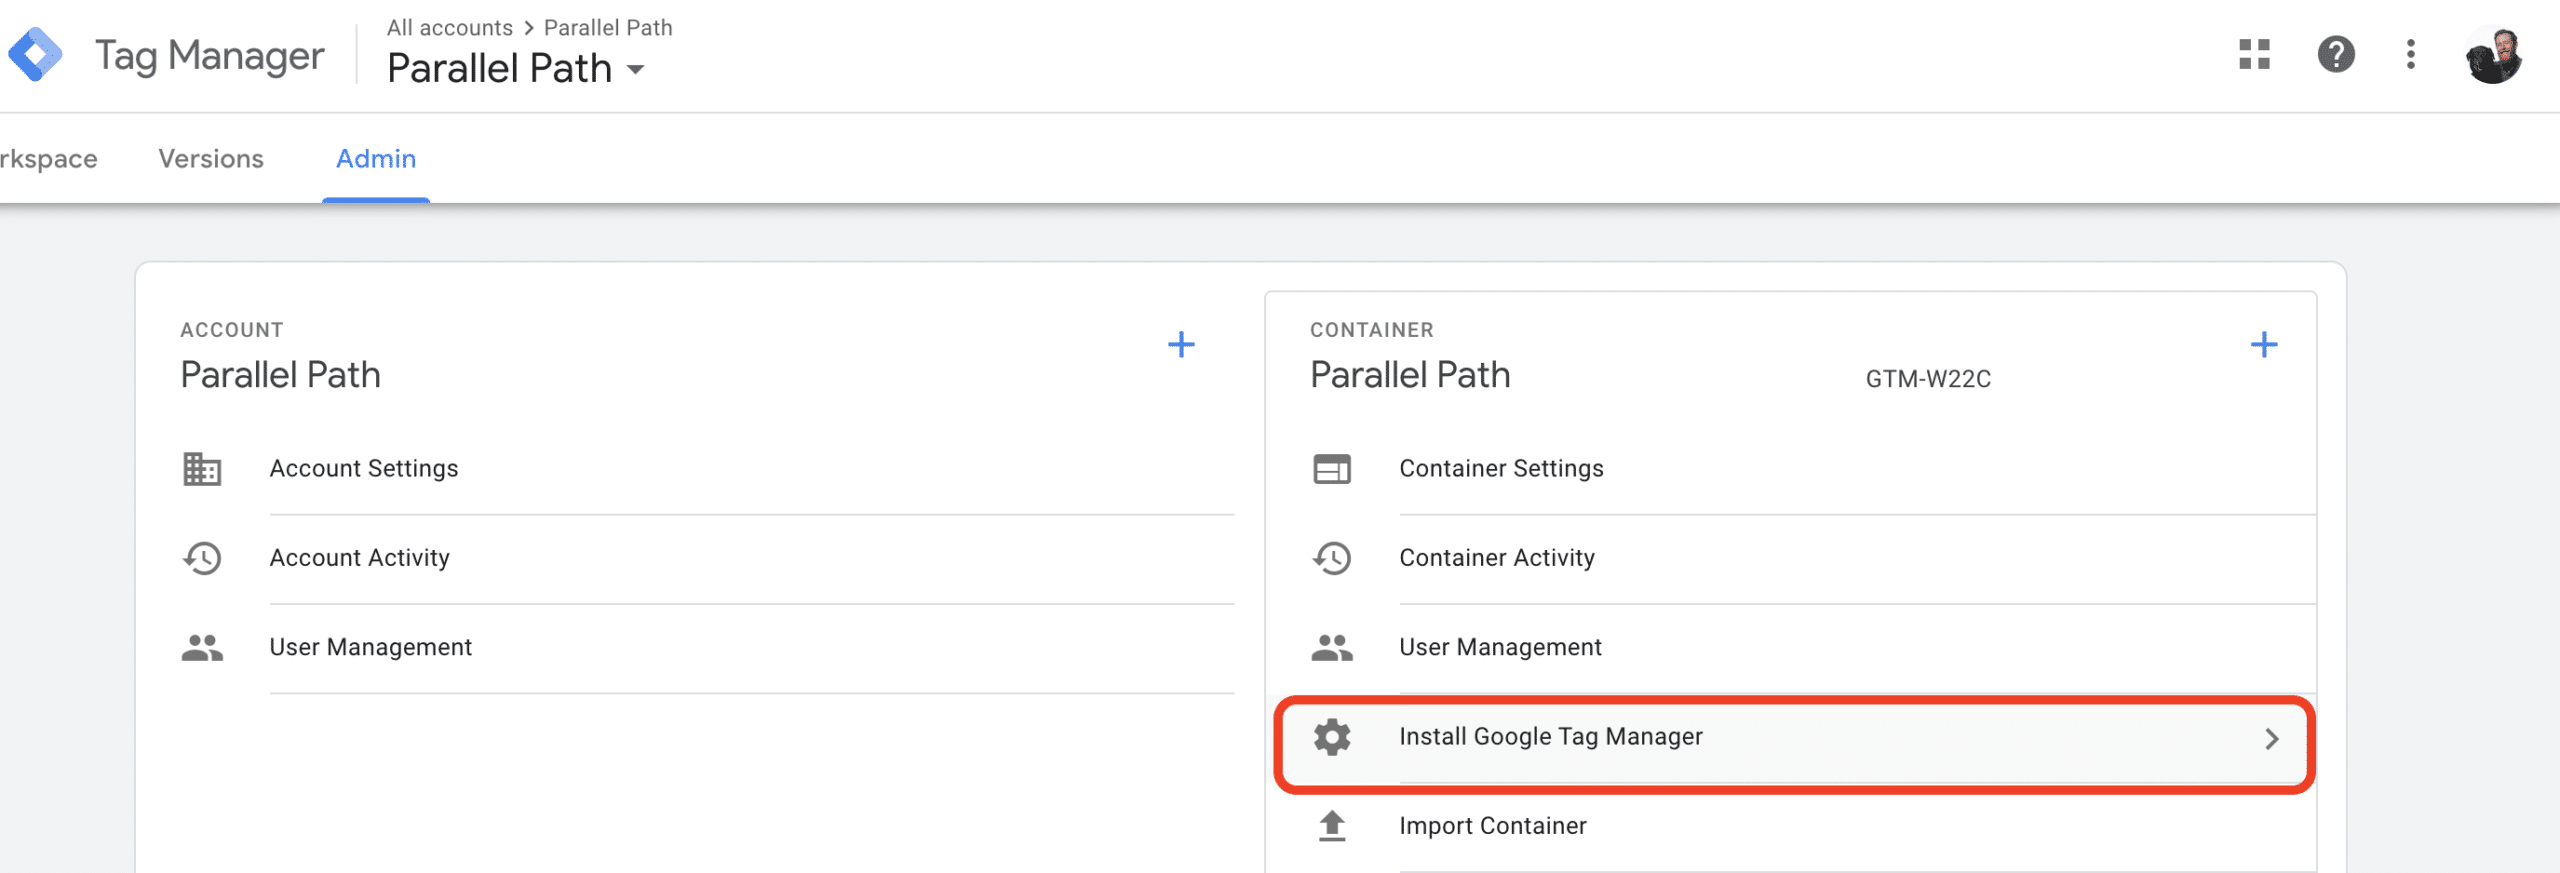
The first portion of the code will need to be placed as high as possible in the <head> section of your page. The second portion of the code will need to be placed as high as possible in the <body> section of your page.
It is recommended to utilize GTM to place your standard GA tracking code on the site. If doing so, it’s imperative that you make sure that you do not have the GA code also hard-wired on your site. This could result in duplicated data. Adding pageview tracking in GTM can be done in three steps.
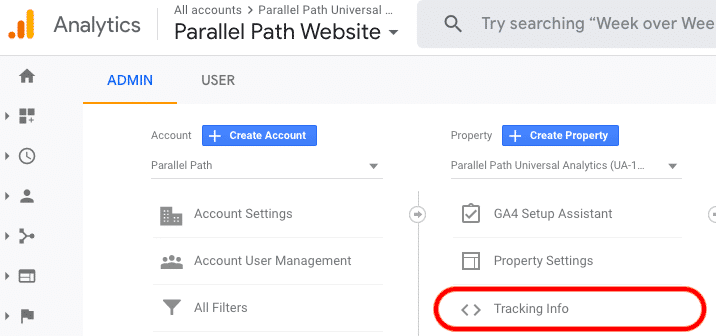
First, create a variable with your Universal Analytics tracking ID, which can be found by clicking “Tracking Info” underneath “Property” within the Admin section of your account.
Second, you create a Universal Analytics Pageview tag, and set it to fire on all pages of your site. Shown below.
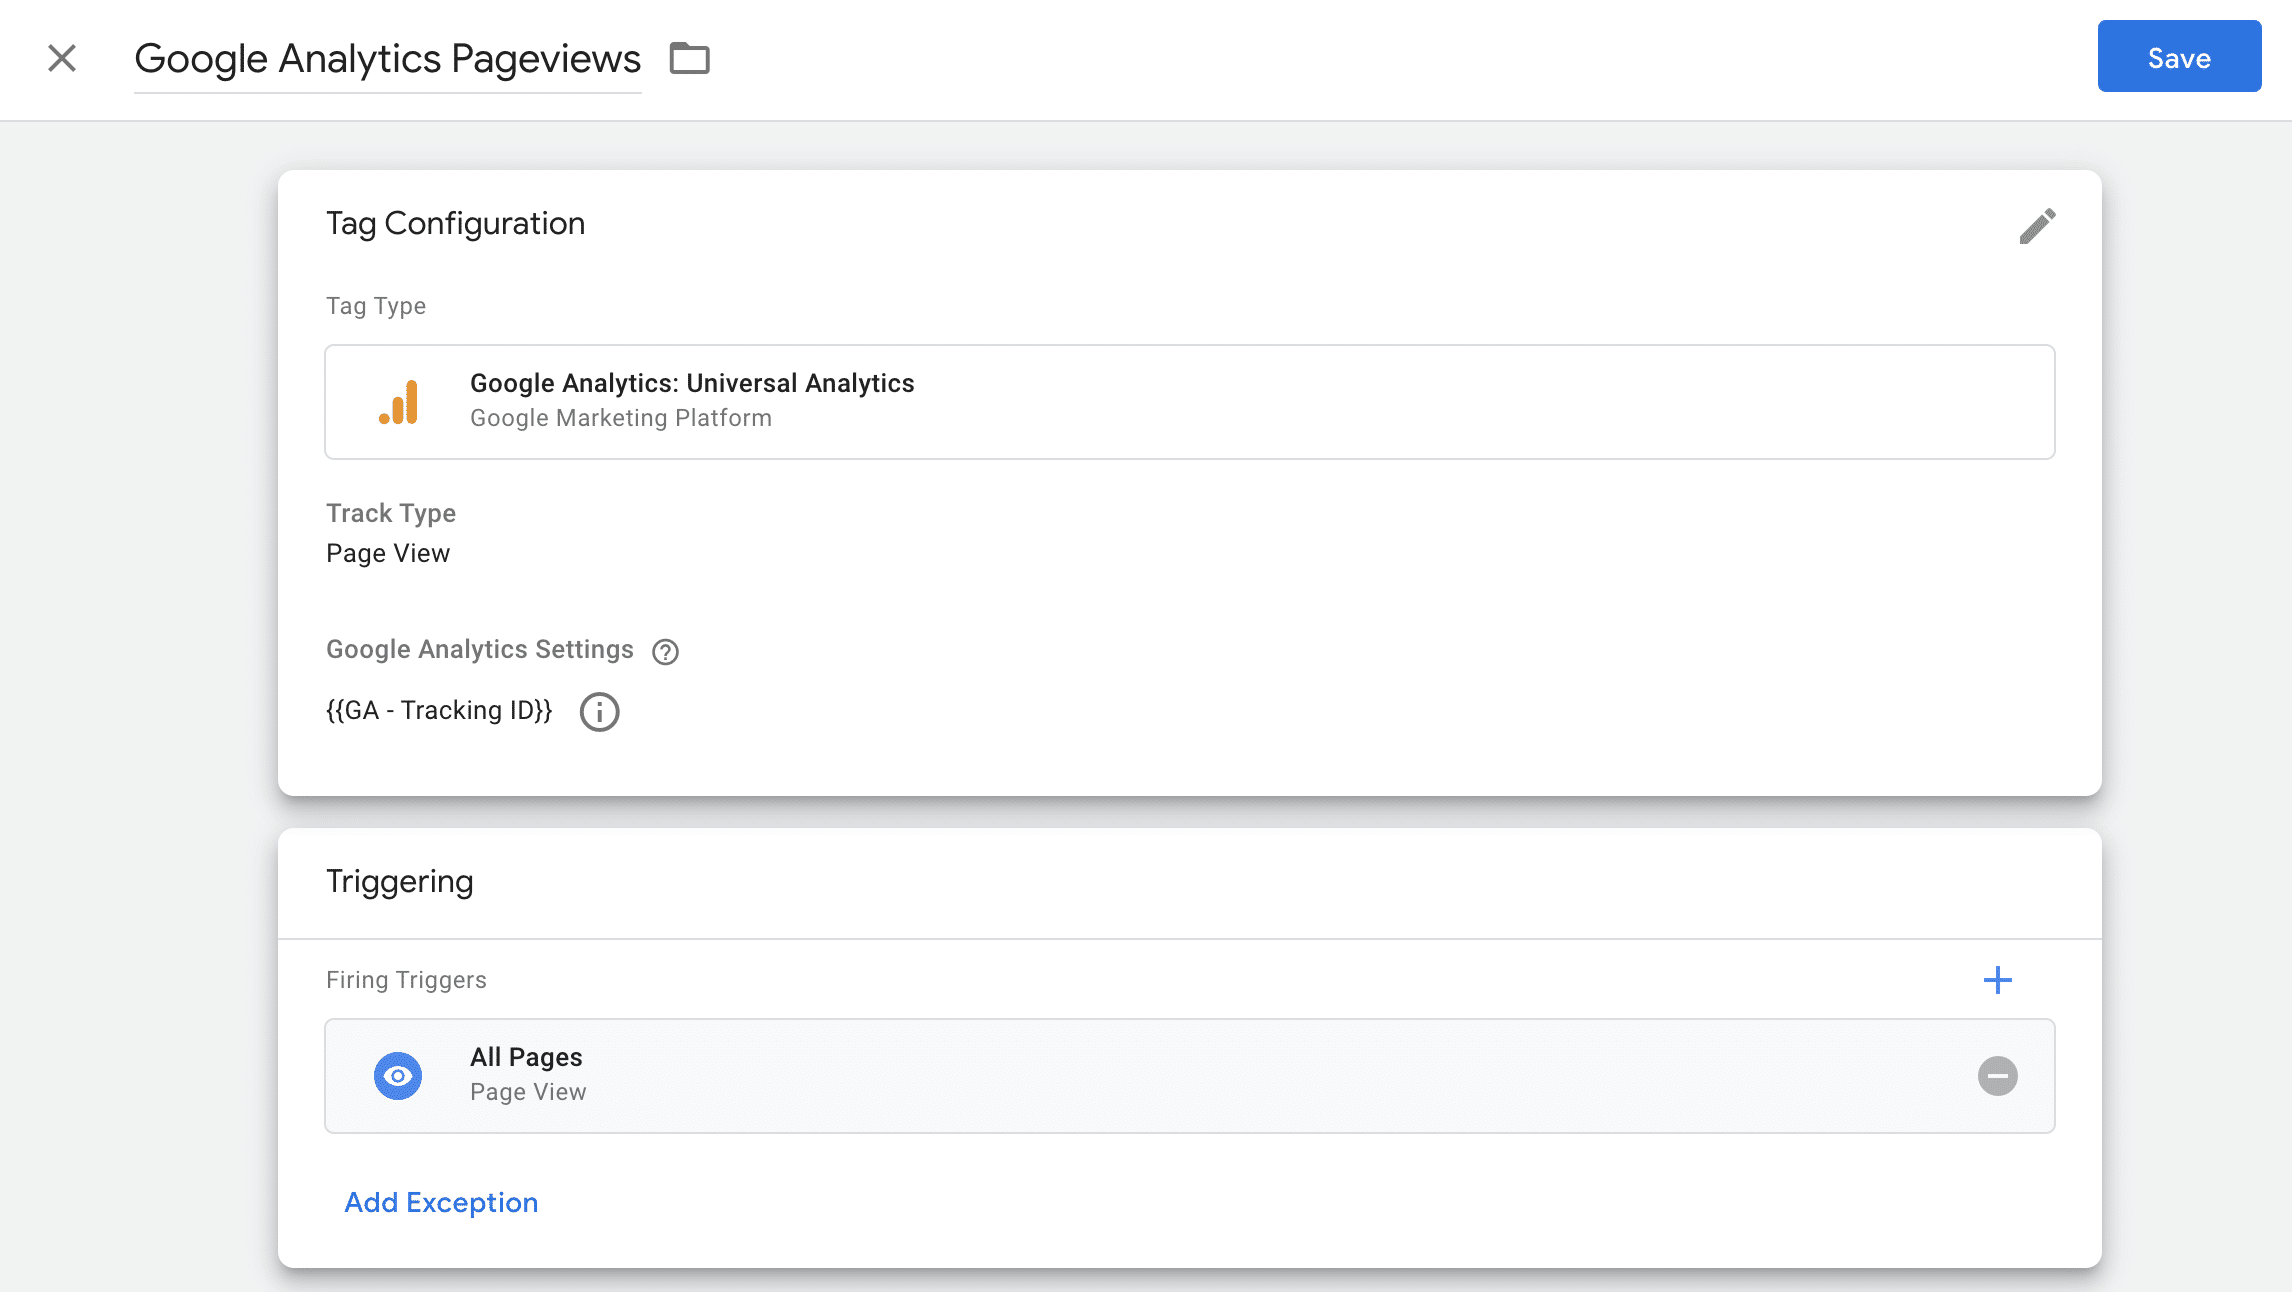
All there is left to do is to QA your changes and publish your GTM container! Then boom, you will start tracking page views through GTM!
Before you cross this item off of your marketing analytics checklist, confirm that the code for channel-specific pixels has also been set up properly on your site. For a new GTM account, that means signing into your various channels to find the necessary code or account information needed to place the pixel within GTM. Many of the most common channels have plug-ins within GTM to make this process easier. Here are the links to the help articles for the most frequently used pixels: Facebook, Google Ads, and LinkedIn. For an existing account, this is as simple as logging into your GTM account to ensure your channel pixels are firing on the correct pages.
The benefit of utilizing GTM to place all of these pixels is that when you develop new pages, all you have to do is ensure the GTM code is coded properly. As long as GTM is placed correctly, all of your other pixels will be there as well.
2. Determine what data you need to collect
Marketers are often afraid that they will miss the opportunity to collect valuable data, so they end up tagging everything they can on their website. Excessive tagging can make it hard for everyone to find the information they are looking for, though, which will complicate data analysis.
To avoid this problem, it’s best to put some thought into what data you need to collect. Ask yourself these key questions:
- What actions am I hoping users will take on the website?
- What types of information are key stakeholders interested in seeing?
- What is the goal of this digital marketing campaign?
Answering these questions can help you determine what data you need to focus on collecting from your site. This way, you don’t muddy your digital analytics with irrelevant or unusable information.
3. Create clear naming conventions for your events
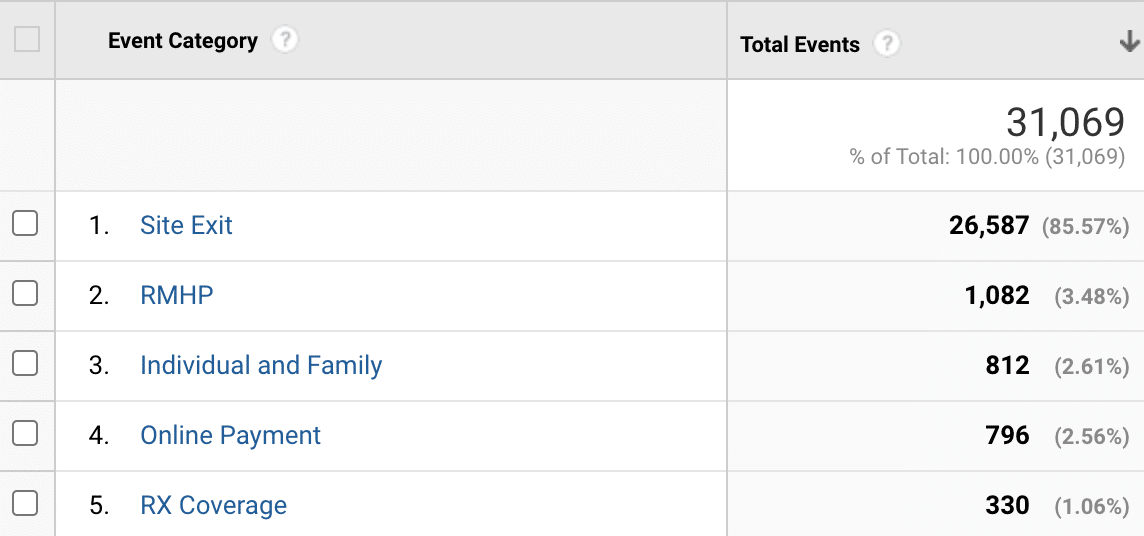
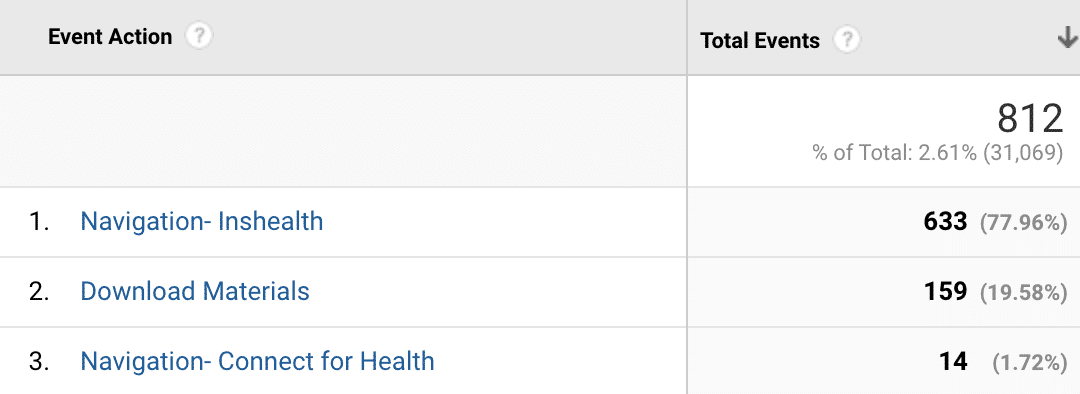
The next step is coming up with clear naming conventions for your events in Google Analytics. An “event” is any action that you want to track on your website that does not result in a new page loading on your site (downloads, click to call, click to email, navigate to social sites). There are three different components of an event in Google Analytics: category, action, and label. You will need to create a name for each of these components.
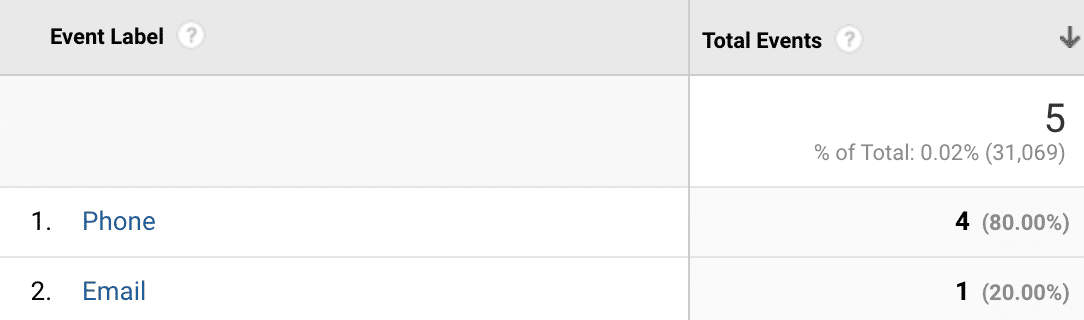
The screenshots below show how these three dimensions work together. Event category is the most top-level information. When clicking into a specific category, you then see all of the “actions” that take place to make up the category. When clicking into a specific “action”, you can see all of the “labels” of the event that make up that action. In the screenshot below, we click into the “contact us” category to see the breakdown of clicks to calls vs. clicks to email.
This may seem insignificant, but establishing clear naming conventions can make it easier for marketers and analysts to sort through the data and quickly find the information they need. If a naming convention is unclear, stakeholders may misinterpret the data or give up on using it altogether.
For example, if you want to analyze data related to plays and downloads of an instructional video on your website, you could create two events with these naming conventions:
- First event
- Category: Videos
- Action: Play
- Label: Instructional
- Second event
- Category: Videos
- Action: Download
- Label: Instructional
This type of naming convention is vague enough that it allows similar events to be grouped together. In this example, both events are categorized as videos, which makes it easy to view all data related to this video. The naming convention is also not too specific, which can make analyzing data more challenging.
Of course, this isn’t the only effective naming convention for Google Analytics events. The key is figuring out what works for your team. For instance, if you are tracking data for multiple lines of business, you may want to use each line of business as a separate event category. This naming convention allows key stakeholders to quickly pull data for their line of business.
4. Meet with key stakeholders
The final step is meeting with key stakeholders to walk them through the events and their naming conventions. The purpose of this meeting is to ensure that all stakeholders understand what data is being collected and how to find it. Everyone who plans on using the data should be included in this meeting.
The meeting plays an important role in making the most out of your data, since the point of collecting this data is to provide it for stakeholders who can use it to make relevant business decisions. If stakeholders don’t understand the data—or if they fail to communicate what data they need to make these decisions—they won’t be able to use it.
5. Keep an event log
Ideally, every stakeholder should be able to log in and immediately understand what an event is tracking based solely on its naming convention. Unfortunately, this may not always happen. No matter how clear and concise the naming conventions are, someone could forget exactly what a specific event is tracking. This is why it’s so important to create an event log outside of Google Analytics that explains each event in detail.
Keep a record of where and how each event is triggered. Be as specific as possible when describing each event. Then, make sure this document is accessible to all stakeholders. This ensures that if questions come up, stakeholders will be able to find the information they need to determine what a specific event in Google Analytics is tracking.
Ensuring that the stakeholders understand and are on board with the plan will increase the likelihood that they will use the data in the way that it was intended.